

EEG Trends in Raw Data
For trained epileptologists, raw EEG provides a treasure trove of information to determine diagnoses and guide treatment. However, in certain circumstances, such as intensive care units and emergency departments, quick and accurate diagnoses are vital for patient care, and there may not be available expert EEG reviewers to read raw data. Arising from this demand, quantitative EEG metrics have been developed to compress raw EEG data into easier to read “trends” or patterns that relate to functioning and outcomes. Below we provide a broad overview describing what trends are in EEG monitoring, and how they can help neurologists quickly assess a patient’s status.
Why Look at EEG Trends?
Trend monitoring arose in the late 90s after researchers observing status epilepticus (SE) noticed that more subtle signs of SE were related to poorer outcomes than those with more obvious SE.1 Subtle signs were related to a lower likelihood of recovering consciousness, longer hospitalizations, and higher mortality rates. These findings indicated the potential benefit of monitoring patterns of activity within EEG in critical care facilities. Three major features that are monitored via trends are frequency, amplitude, and asymmetry.
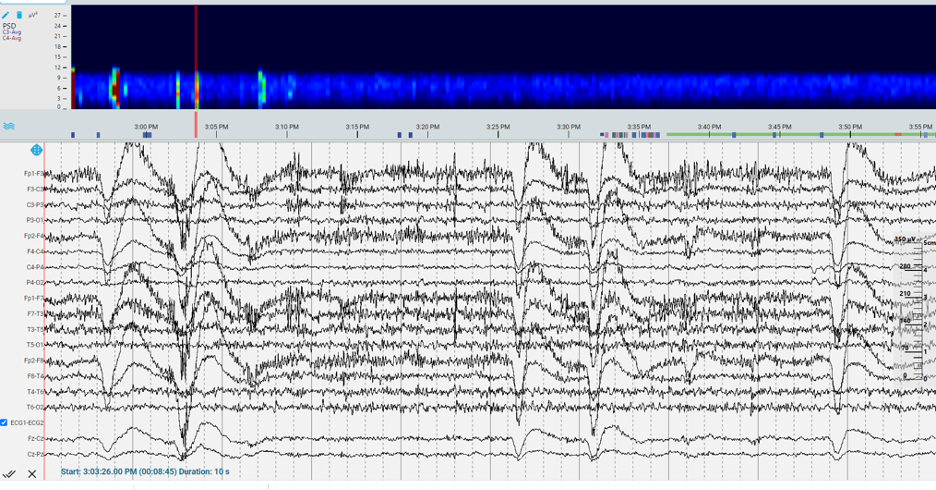
Trends in Frequency
The EEG signal is composed of multiple waves that can be decomposed into set frequency bands (i.e., delta, theta, alpha, beta, and gamma activity). Monitoring trends in frequencies provides a visualization of the power for each of the frequency bands over a period of time. Clinicians reviewing trends in frequency bands can screen for acute state changes, as well as suppression activity. These trend analyses can also determine possible seizure patterns by identifying abrupt changes in power across a range of frequencies.
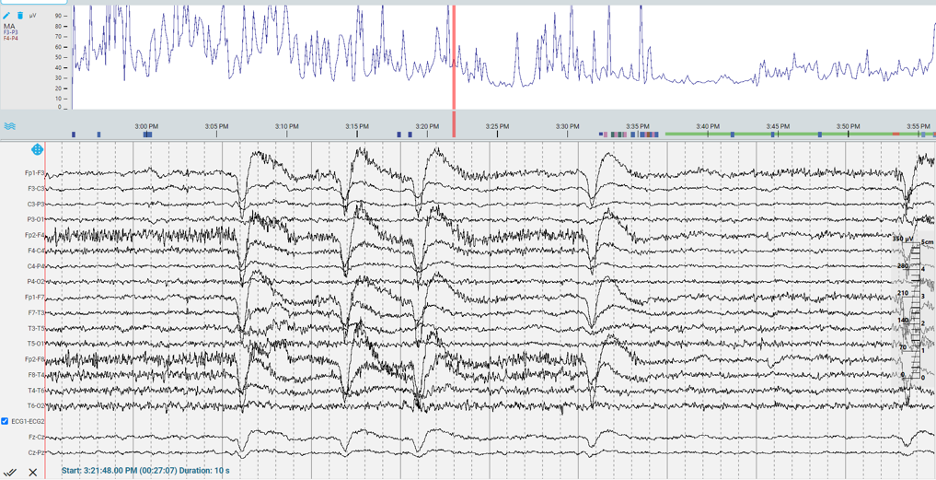
Trends in Amplitude
Another feature of the EEG signal is the amplitude of the wave. Trend monitoring of amplitude can convert the raw signal into a series of overall amplitude measurements, marking the maximum and minimum observed in the raw data. Although frequency trends tend to be used more in practice, research with amplitude trends has identified some utility in common clinical scenarios. For example in one small study, amplitude trends were useful in differentiating positive from poorer outcomes after hypothermia2.
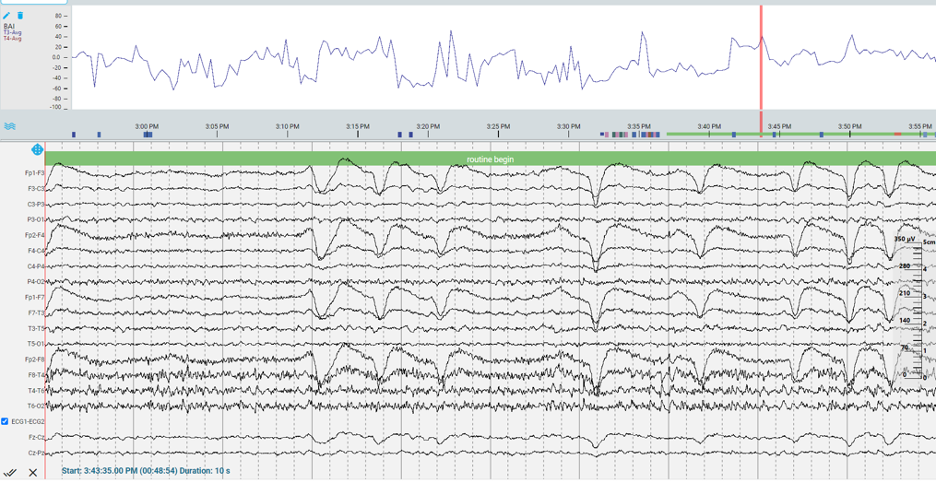
Trends in Asymmetry
Clinicians can also look at the relative synchronicity between brain hemispheres to determine whether a pathological condition exists. Although healthy cerebral activity is not perfectly symmetrical, generally activity within the two hemispheres will be similar with only mild asymmetry. Trends, such as the amplitude asymmetry index (AAI) and brain symmetry index (BSI) measure the differences in activity between hemispheres and can be used to detect abnormality.
Additional EEG Trend Measures
Below are some other trend measures that are routinely used:
- Burst suppression ratio (BSR) measures how long an EEG signal spends in a suppressed state. This is commonly used to estimate the depth of consciousness within anesthesia monitoring.
- Non-linear energy operator (NEO) provides an estimate of the energy within an EEG waveform. This measure has potential as a spike detection marker since it accentuates high-frequency content, but is susceptible to muscle and electrical artifact.
- Relative alpha variability (RAV) calculates variation of alpha-band power over time. A decreased RAV can indicate hemorrhagic vasospasm requiring medical intervention.
The Future Potential for EEG Trends
EEG trends can supplement (but do not replace) the review of raw data. Sensitivity and specificity vary depending on the specific condition being assessed. Currently, the most widely used trend is the burst suppression ratio – commonly used in intensive care units to monitor the depth of medically induced comas. Other trends have yet to achieve a wide level of adoption, because, for the most part, the field is waiting on clinical researchers to demonstrate their clinical impact. Regardless, year-over-year growth in EEGs ordered in intensive care units and regular hospital floors are increasing dramatically. So much so that in a few years, without some type of trending software in use, the volume of studies will reach a crisis point where there will be too much raw data for physicians to interpret, especially in a timely fashion.
One factor which may accelerate the confirmation of particular trends having clinical utility is the increasing use of artificial intelligence, specifically machine learning techniques. These appear to have the greatest chance to raise EEG trends to the next level – as much of machine learning works off of features of data rather than the data itself. For EEG, those features are essentially trends.
About the Author
Jeremy D. Slater, MD, FAAN, FAES, FACNS is the Chief Medical Officer for Stratus. Dr. Slater has worked in the field of epilepsy for more than 27 years and has served as an investigator for numerous clinical trials and research initiatives. He served as Director of the Texas Comprehensive Epilepsy Program, one of the largest epilepsy surgery programs in the country, and currently heads up MERLN, Stratus’ R&D division.
Sources:
- Treiman DM, Meyers PD, Walton NY, Collins JF, Colling C, Rowan AJ, et al. A comparison of four treatments for generalized convulsive status epilepticus. Veterans Affairs Status Epilepticus Cooperative Study Group. N Engl J Med. 1998;339(12):792-8. doi:10.1056/NEJM199809173391202
- Rundgren M, Rosen I, Friberg H. Amplitude-integrated EEG (aEEG) predicts outcome after cardiac arrest and induced hypothermia. Intensive Care Med. 2006;32(6):836-42. doi:10.1007/s00134-006-0178-6